ETL Data Pipeline
An Apache Spark ETL data pipeline processing large datasets of Google Local reviews and businesses and loading them into a Data Lake on S3 as well as a Redshift Data Warehouse
Background & Objectives
This project was the capstone for the Udacity Data Engineering Nanodegree
The (imaginary) goal of this project was to create an ETL data pipeline to clean, process and enrich data from Google Local reviews of US-based businesses on Google Local and make it available for analysis by two different teams:
- a team of data scientists working on a Machine Learning model to cover a wide range of business categories
- a team of data analysts that will perform an exploratory analysis of restaurant reviews for a business client who owns a US-based Italian restaurant chain
Data & Code
We have three datasets as input:
- reviews.json contains over 10 million reviews of Google Local businesses across the world (download from here)
- places.json contains data related to Google Local businesses across the world (download from here)
- us_population_by_zipcode.csv which contains the opopulation totals for all zipcodes in the USA (obtained from here)
The code to execute this pipeline and launch the Redshift cluster is available on my Github page here
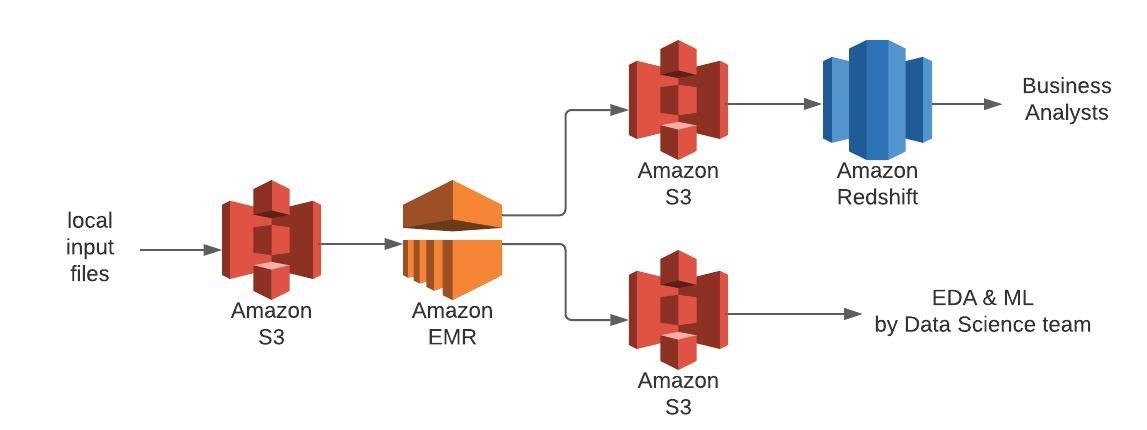
Data Pipeline Architecture
The first step in the project was to define a high level view of the data pipeline and decide on the most appropriate tools & technologies. As the main dataset contains over 10 million rows, a distributed processing solution was required and Apache Spark was used to speed up the initial assessment of the data performed via a Jupyter notebook, as well as the ETL pipeline itself. To make full use of Spark's parallel processing capability, the pipeline is executed on an AWS EMR cluster running 3 instances.
To store the large dataset for the team of Data Scientists, I opted for a Data Lake on S3 using parquet format files, as this storage type is much cheaper than a data warehouse but still fast to query and compatible with Python tools to perform exploratory analyses and ML model development. This low-cost storage option meant we could keep the full text of the reviews for a potential NLP analysis as well.
As business analysts are deemed to have a different set of technical skills from the Data Scientists and primarily use SQL to query their data directly, I opted to create a smaller Data Warehouse using a Redshift database, containing only the data pertinent to their case study in order to minimise the cost (i.e. excluding the full review text, and including only categories relating restaurants, though the category is parameterised, should another project arise in the future that requires data for a different business category). A temporary data lake was created first on S3 as a staging dataset before loading the data into a Redshift database.
Below is a diagram of the data pipeline's high level architecture
Data Processing & Transformation
An initial analysis of the data was performed to assess data quality and identify opportunities for feature engineering to enrich the dataset. As a result of the analysis, the following steps were included in the data pipeline:
- reformat the json files so they can be read as json by pySpark without corruption errors caused by formatting issues
- remove non USA-based reviews (country derived from postcode)
- enrich with local population data
- drop irrelevant features such as GPS coordinates and phone numbers
- drop rare categories where not enough reviews were available for a meaningful analysis
Some additional features were engineered as they could be a factor in the rating given by a user. e.g. the average rating given by each unique user, the day of the week and whether the review was written during the day or at night (which could influence the mood of the user at the time of writing).
The datasets were then combined into a large Data Lake containing all the reviews for US-based businesses, partitioned by business category. This column was chosen for partitioning as it's a likely candidate for aggregation in an ML model i.e. it is likely that a different model would be developed for each category, or group of categories.
In parallel to the Data Lake above, a temporary staging data lake was created without column partitioning. This was a necessary step as the COPY command to load the data into a Redshift Data Warehouse cannot otherwise include the partitioning column when reading from parquet files. Although this sadly meant an additional step in the pipeline, it was very fast and did not adversely impact the total processing time.
Amazon Redshift Data Warehouse data model
The data model for the Data warehouse is based on the STAR model. This format was selected as it is very clear and easily understandable and usable by the business analysts. The DW contains one fact table with the reviews data and three dimension tables containing details about places (businesses), users and population.
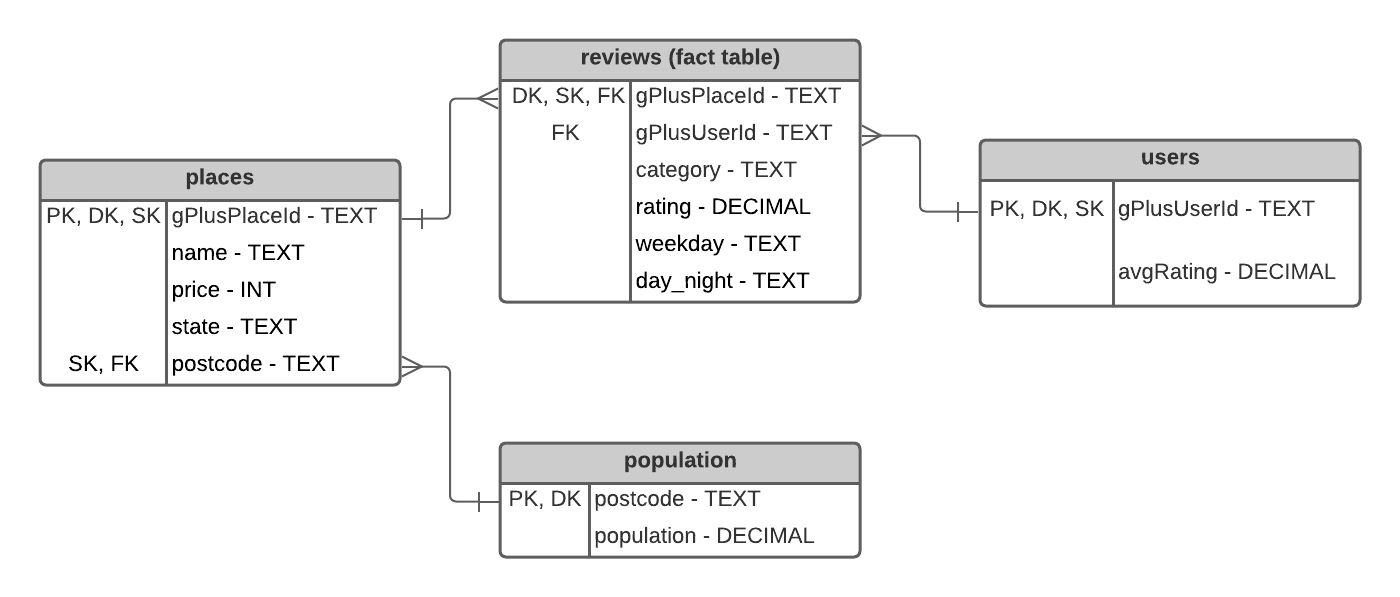
Each row in the database is a review left by a user for a business in a category. If a business fits several categories, there is a record per category i.e. the same review is duplicated for each category representing the business, to allow aggregation at the category level.
NB: If there was a unique category per business, the category related to each business in the review would normally be more logically included on the places dimension table. However, as places can be represented by a number of categories (e.g. both Restaurant, Italian Restaurant and International Restaurant), I wanted to allow the business analyst to query by category to enable a more granular analysis. Having several records for the same place on the places table would have broken the referential integrity of the gPlusPlaceId foreign key between the reviews table and the places table.
In order to optimise query efficiency on the Redshift DW, I indicated Distribution Keys as well as Sort Keys in the schema.
- The reviews table is distributed and sorted by gPlusPlaceId, to allow for efficient joining with the places table.
- The places table is distributed by gPlusPlaceId to allow efficient joining with the reviews table
- The users table is distributed and sorted by gPlusUserId as this is the primary key and the foreign key referenced by the reviews table
- The population table is distributed by postcode, to allow efficient joining with the places table.
Adapting the pipeline to a different scenario
What if the pipeline needed to be run on a daily basis?
This current project is a once-off pipeline using historical data. However, if we were to collect the same data daily from a Google API, the same pipeline could be used with slight modifications (to append to the data lake & data warehouse instead of replacing the data with each job) and scheduled & monitored using Apache Airflow.